Lorris Toolbox is an open source application for working with embedded systems and micro-controllers which was developed by Vojtěch Boček in the Czech Republic. This toolbox of tools has a feature packed packet analyzer tool which makes analyzing and interpreting packets simple. Both Wireshark and Microsoft’s Message Analyzer can also capture packets over the network and USB traffic, but they depend on fixed pre-defined protocols, whereas the Lorris Toolbox Analyzer lets you specify the protocol and lets you process the data.
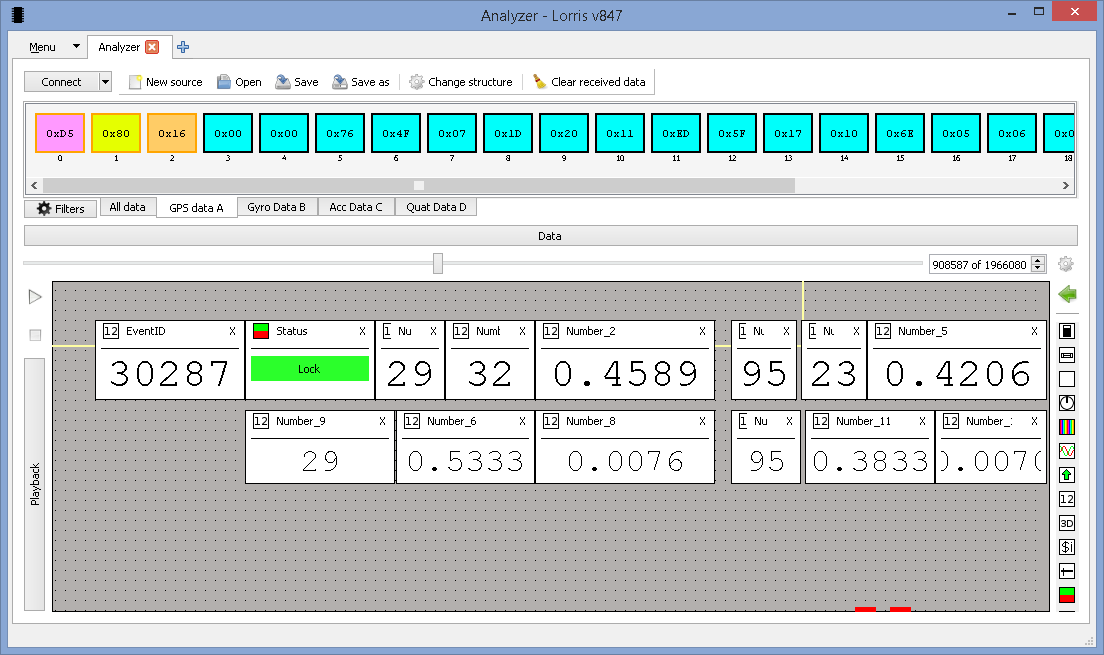
Packets
Packets are messages arranged in a known format, which allows for one system to communicate to another. When embedded systems such as your smartphone connect to the internet, a set of standardized packets govern its successful communication to the internet. Often serial communication is used when communicating from one embedded system to another, and for that format less communication channel it’s the embedded engineer’s job to choose a communication protocol that will govern the connected systems communication.
Packets often begin with a header, or a set of bytes to describe the contents of the packet, followed by the actual data of the packet. Lorris Toolbox Analyzer lets you describe your custom header so that the application can parse the serial port, network stream, or data file that you point it to. In your header you can specify static bytes (which are typically the start of packet bytes), length bytes, command bytes, and device id. Most of those bytes are optional, but if they are available they can help provide additional packet filtering capabilities.
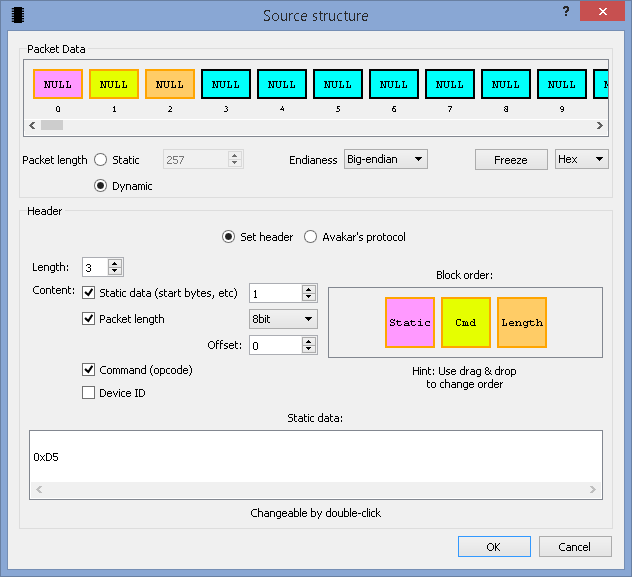
Lorris provides the ability to decode packets into human readable form, provided that the bytes in the packets follow a fairly standard format. Byte stuffing, or escape characters are not supported so those packets would require pre-processing before importing them into Lorris. Each graphical tool provided is described as a ‘widget’, which allows you to display numbers and lets you perform math involving a single field prior to displaying. It also provides 2D and 3d graphing capabilities that lets you graph data in real-time which enables one to quickly view and validate the data packets.
Filters
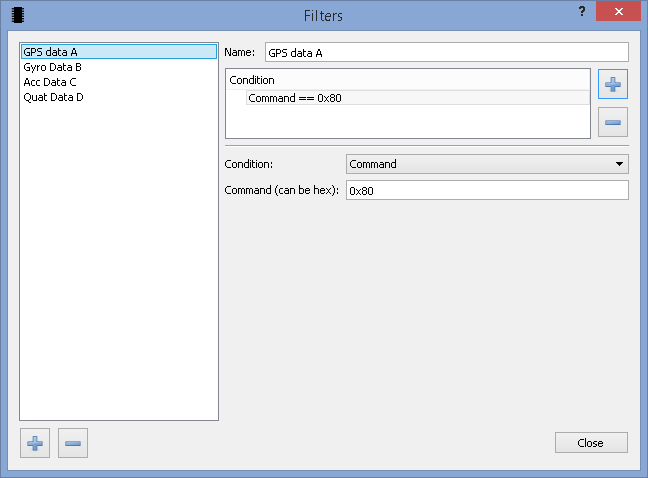
Filters provide the ability to filter out specific packet id’s so that special processing can occur on the selected subset of packets. The following figure shows the definition of a filter that picks out just GPS data (arbitrarily assigned the ID 0x80). On the left you can see that there are several other filters defined.
Widgets
Once the format of each packet is defined, one can link fields of each packet to many different kinds of widgets that can be drag onto the workspace from the right hand side.
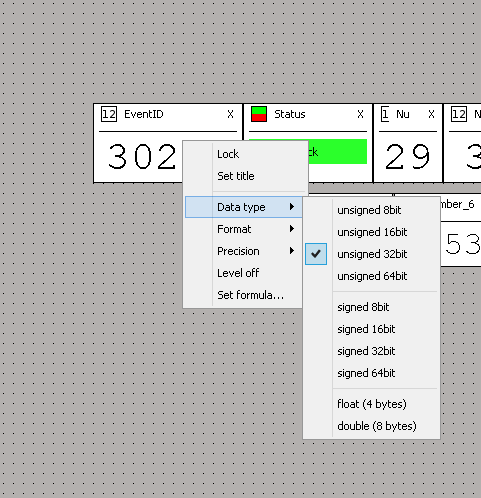
Once a widget is placed, fields from the packet need to be dragged from the data bar at the top, and dropped onto the actual widget for that widget to be linked to that field. The datatype, format, precision, and a simple formula can be modified so that the data is in a better format. The formula field is meant for simple calculations, since you can’t reference other numbers or more than one group of cells (depending on the datatype). Scripting gets around this limitation and will be explored in greater detail.
Status
The status box can be used as a part of a simple UI to quickly show pass/fail states, or a list of states.
Number Boxes
When a number box widget is dragged onto the workspace, one can drag the byte field that should be displayed in the field, or in the case of a 1, 2, 4, or 8 byte field, one would drag the first byte and define the corresponding datatype. Lorris supports 8, 16, 32, and 64 bit signed and unsigned numbers.
2D Graph
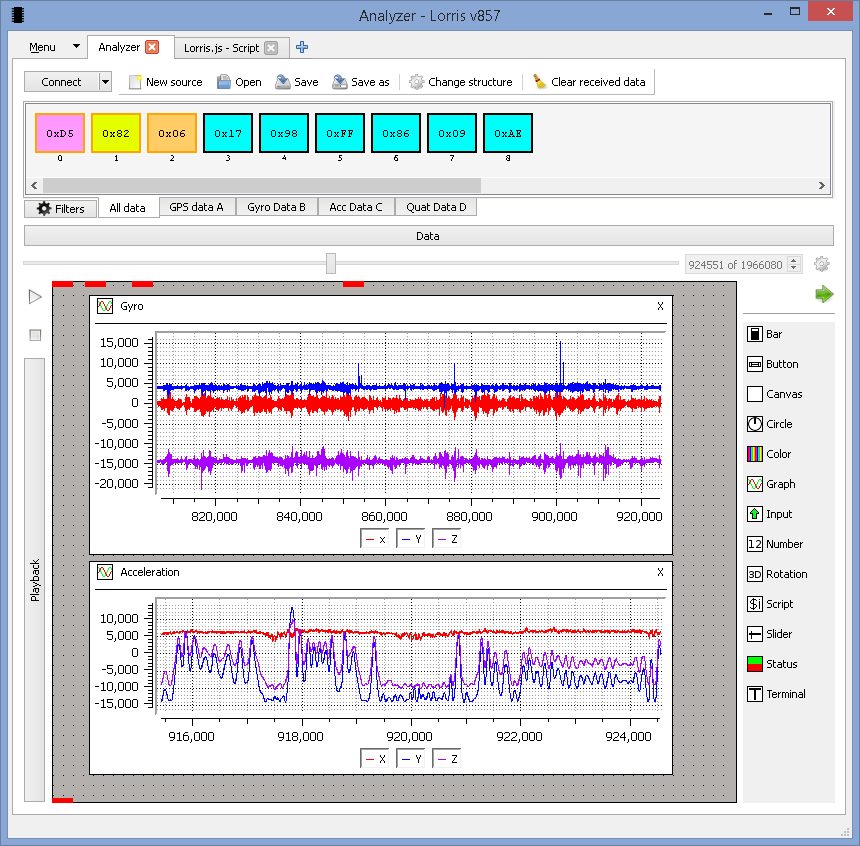
The graphing abilities of Lorris are decent, although it can be a little bit un-intuitive at times. Since Lorris can graph data as it comes in, if the user adjusts the graph while it is graphing data, the graph automatically re-adjusts so that the latest received datapoint is graphed. The center mouse button is used to select the zoom area on the graph. The legend at the bottom not only shows the label of each plot line, but by clicking on a particular plot line in the legend box one can disable or enable the corresponding signal.
Scripting
The scripting widget lets the user create any widget that can be created manually using the Javascript or python language, with many examples for each language. With this widget the user can quickly write a function to parse multiple packets into a form that’s desirable (eg showing acceleration on an 2D line plot). For instance a packet of GPS information is parsed into its latitude, longitude, date, and time information. With the canvas drawImage method, one can draw GPS data points on a map and highlight it with an arrow, circle, or another image.
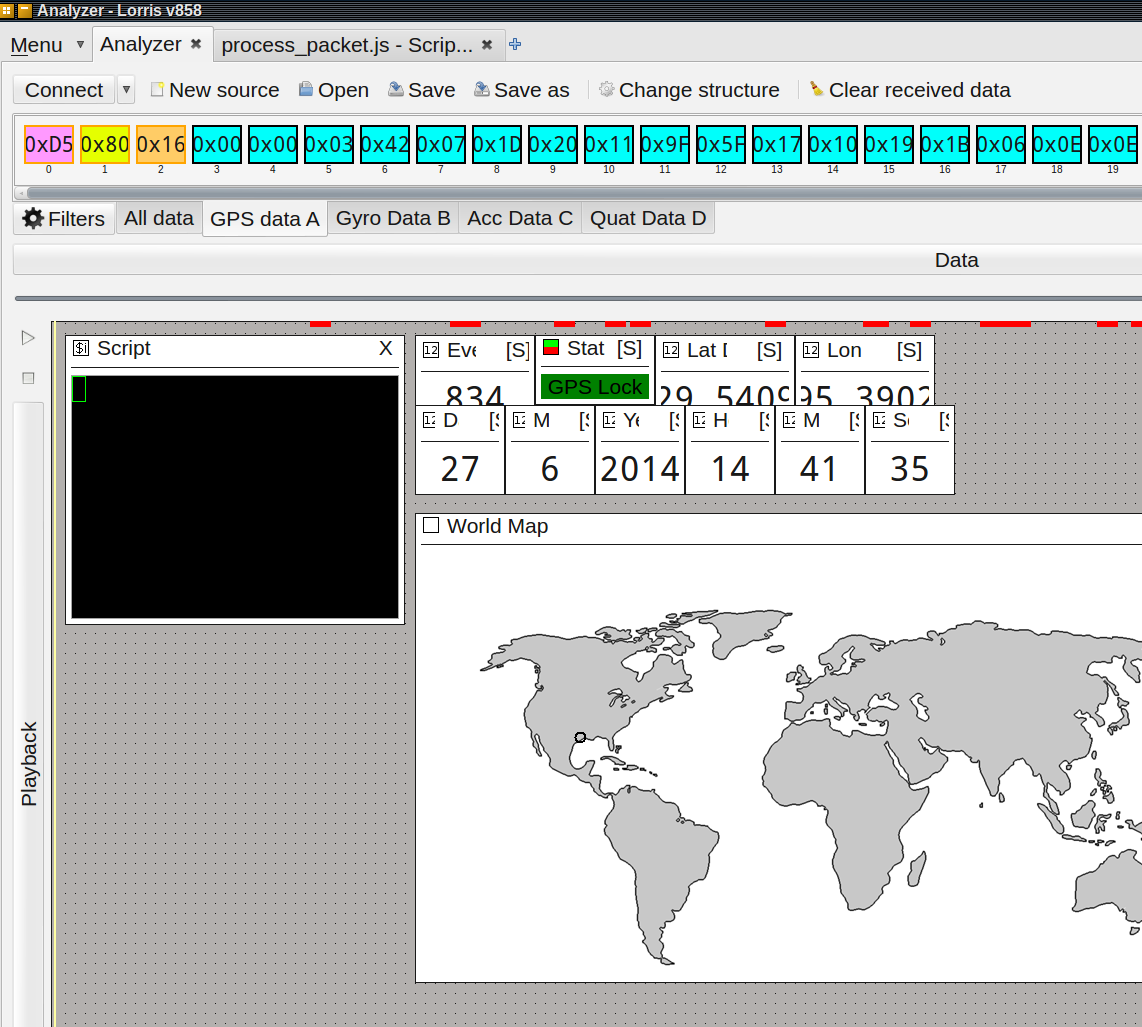
The scripting widget also supports user input directly from the Lorris interface, in the form of different widgets such as the bar, button, input, slider, and terminal widget. Using the input widget the scripts that you create can be changed easily on the fly, letting the user create a dynamic interface with respect to the packets that are being analyzed (for instance if an error packet is detected, the user could pop up an Input widget for the user to see and react to).
Conclusion
The Lorris Toolbox Analyzer is an impressive open source custom form data analyzer which not only gives the user simple tools to quickly process data, but more advanced tools that allow the customization of each user interface as desired. In order to understand a large amount of data, typically one would need to convert that data into a spreadsheet compatible format or build a custom application that processes the data. With Lorris Toolbox Analyzer, the user can interpret the packet format, filter the specific packets, and graph it in just a few steps.